IC Markets Home Sign in Web Trader Contact Us
IC Markets Social IC Markets Social

Information Hub for
Serious Traders

  • ABOUT US
  • OPEN LIVE ACCOUNT
  • OPEN DEMO ACCOUNT
  • TRADE NOW
  • VISIT OUR BLOG
IC Markets Social
  • ABOUT US
  • OPEN LIVE ACCOUNT
  • OPEN DEMO ACCOUNT
  • TRADE NOW
  • VISIT OUR BLOG
November 18, 2021North_American_Stocks_esIC Markets

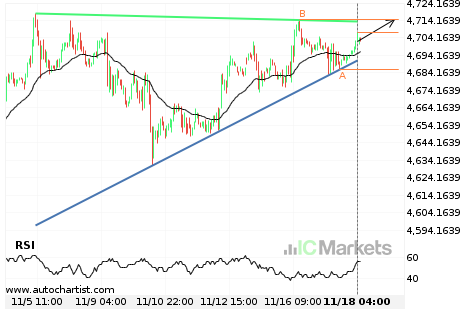
Posible ruptura del nivel de resistencia en el US SPX 500 Index

El US SPX 500 Index avanza hacia la línea de resistencia de un Triángulo ascendente, que ya ha probado varias veces en el pasado. Hemos visto un retroceso antes desde esta línea, así que en esta etapa no está claro si atravesará esta línea o se recuperará como lo ha hecho anteriormente. Si el US […]

Read more
November 16, 2021North_American_Stocks_esIC Markets

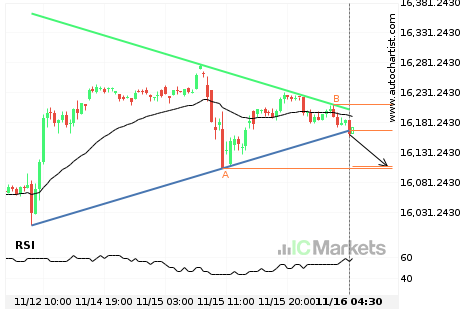
Se espera un gran movimiento del US Tech 100 Index

El US Tech 100 Index ha atravesado una línea de soporte de un Triángulo y sugiere un movimiento posible a 16108.2798 dentro de las próximas 13 horas. Ya ha probado esta línea en el pasado, por lo que deberíamos esperar la confirmación de esta irrupción antes de entrar en acción. Si dicha ruptura no se […]

Read more
November 15, 2021North_American_Stocks_esIC Markets

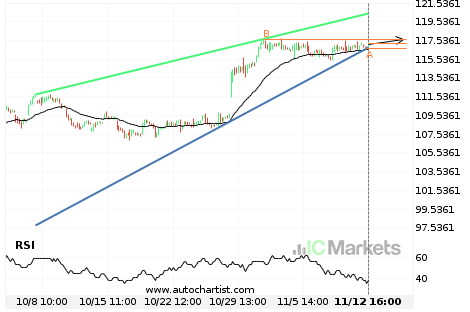
¿Tendrá el AbbVie suficiente impulso como para irrumpir la resistencia?

El AbbVie se dirige hacia la línea de resistencia de un Cuña ascendente y puede alcanzar este punto en las próximas 3 días. Ha probado esta línea ya en numerosas ocasiones en el pasado, y esta vez no tendría porqué ser diferente y terminar con una recuperación en lugar de una irrupción. Si ésta última […]

Read more
November 12, 2021North_American_Stocks_esIC Markets

US Tech 100 Index – acercándose a el soporte del Canal bajista

El US Tech 100 Index avanza hacia la línea de soporte de un Canal bajista. Como le hemos visto retroceder desde esta línea ya antes, podríamos presenciar, o bien, una irrupción a través de esta línea o una recuperación a los niveles actuales. Ha llegado a esta línea en numerosas ocasiones en los últimos 7 […]

Read more
November 11, 2021North_American_Stocks_esIC Markets

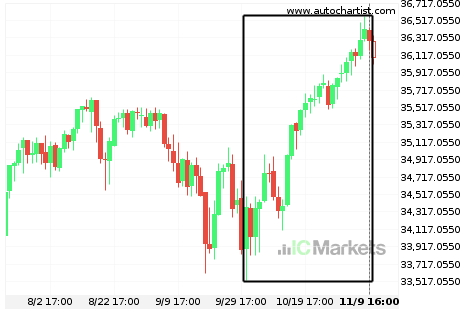
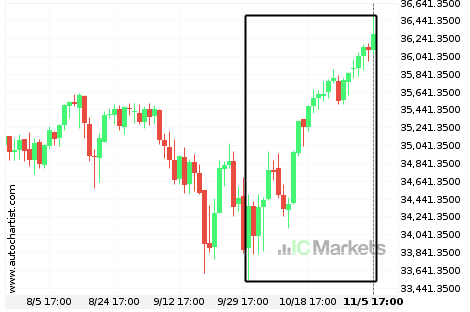
¿Qué está ocurriendo con el US Wall Street 30 Index?

Aquellos de ustedes que sean seguidores de tendencia probablemente estarán observando ansiosamente al US Wall Street 30 Index para comprobar si el último movimiento de un 5,58% continúa. Si no lo hace, las personas fieles al método de reversió de la media estarán encantadas de ganar con este excepcional movimiento en 41 días.

Read more
November 10, 2021North_American_Stocks_esIC Markets

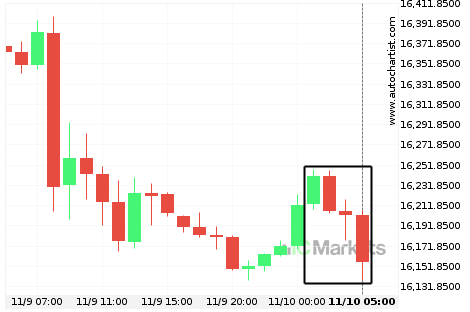
El US Tech 100 Index experimentó un movimiento excepcional

Para aquellos de ustedes que no creen en las tendencias, esta puede ser una oportunidad para aprovechar un excepcional movimiento de un 0,52% de US Tech 100 Index. Este movimiento está ocurriendo desde hace 4 horas. Por otro lado, para aquellos que siguen las tendencias, deben considerar aprovecharse de esta.

Read more
November 9, 2021North_American_Stocks_esIC Markets

US Small Cap 2000 Index – acercándose a la resistencia del Canal alcista

El US Small Cap 2000 Index avanza hacia la línea de resistencia de un Canal alcista. Como le hemos visto retroceder desde esta línea ya antes, podríamos presenciar, o bien, una irrupción a través de esta línea o una recuperación a los niveles actuales. Ha llegado a esta línea en numerosas ocasiones en los últimos […]

Read more
November 8, 2021North_American_Stocks_esIC Markets

¿Hacia dónde se dirige el US Wall Street 30 Index?

Un movimiento de un 5,61% en 37 días de US Wall Street 30 Index no pasa desapercibido. Puede empezar a considerar hacía donde se dirigirá ahora: si seguirá con la tendencia ascendente actual o volverá a la dirección anterior.

Read more
November 5, 2021North_American_Stocks_esIC Markets

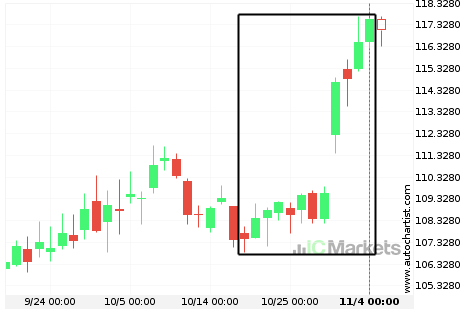
El AbbVie experimentó un movimiento excepcional

Para aquellos de ustedes que no creen en las tendencias, esta puede ser una oportunidad para aprovechar un excepcional movimiento de un 9,42% de AbbVie. Este movimiento está ocurriendo desde hace 17 días. Por otro lado, para aquellos que siguen las tendencias, deben considerar aprovecharse de esta.

Read more
November 4, 2021North_American_Stocks_esIC Markets

¿Hacia dónde se dirige el US Wall Street 30 Index?

Un movimiento de un 4,87% en 34 días de US Wall Street 30 Index no pasa desapercibido. Puede empezar a considerar hacía donde se dirigirá ahora: si seguirá con la tendencia ascendente actual o volverá a la dirección anterior.

Read more
  • 1
  • 2
  • 3
  • …
  • 70
  • 71
  • 72
  • 73
  • 74
  • 75
  • 76
  • …
  • 89
  • 90
  • 91

Recent Posts

  • Either a rebound or a breakout imminent on SILVER
  • GOLD Nível visado: 2976.3601
  • A potential bearish movement on GOLD
  • มีโอกาสเกิดการเคลื่อนตัวแบบ bearish บน GOLD
  • Posible gran movimiento en el AUDJPY

Recent Comments

    Translation


     Edit Translation

    Trade with

    a market leader you can rely on

    Open Trading Account Try a Free Demo

    Forex Trading

    • Accounts Overview
    • Open an Account
    • Launch Web Trader

    Trading Specifications

    • Spreads and Commissions
    • Range of Market
    • Trading Hours
    • Funding
    • Withdrawal

    About IC Markets

    • Help Center
    • Why IC Markets
    • Regulation
    • Legal Documents
    • Contact Us


    Forex Trading

    • Accounts Overview
    • Open an Account
    • Launch Web Trader

    Trading Specifications

    • Spreads and Commissions
    • Range of Market
    • Trading Hours
    • Funding
    • Withdrawal

    About IC Markets

    • Chat with a Specialist 24/7
    • Why IC Markets
    • Regulation
    • Legal Documents
    • Contact Us

    Disclaimer: This material is marketing material where all marketing material is published for informational purposes only. This material does not contain and should not be considered as containing - investment advice and recommendations, or suggestions for performing any actions with financial instruments. The built-in widgets belong to their external independent authors, and IC Markets is not responsible for their content and their impact on trade.

    All content rights reserved. Opinions of the authors may not coincide with the opinion of the blog editors. When copying materials from this site or connecting to an RSS feed to republish our articles, a link to IC Markets or attribution in the format ‘IC Markets Blog’ is required. For general questions, please contact the editorial office via the form on the Contact us page.

    Risk Warning: Trading Derivatives carries a high level of risk to your capital and you should only trade with money you can afford to lose. Trading Derivatives may not be suitable for all investors, so please ensure that you fully understand the risks involved and seek independent advice if necessary. A Product Disclosure Statement (PDS) should be considered before entering into a transaction with us.

    The contents of this page are general information only and does not take into account your personal situation, financial objectives or needs. It is up to you to make sure the products that we offer suit your specific needs. You should not trade with us unless you understand the features and risks of the products that we offer. This means that you might need to seek independent advice before you start trading with us.

    © 2022 Raw Trading Ltd | All rights reserved.
    • Sample Page